TEN DRONES
5 DAYS
MORNING PEAK-HOUR
100+ INTERSECTIONS
MASSIVE URBAN TRAJECTORY DATASET
OPEN ACCESS
GLOBAL IMPACT
PERFECT FOR PHD
A first of its kind experiment
pNEUMA is an open large-scale dataset of naturalistic trajectories of half a million vehicles that have been collected by a one-of-a-kind experiment by a swarm of drones in the congested downtown area of Athens, Greece. A unique observatory of traffic congestion, a scale an-order-of-magnitude higher than what was not available until now, that researchers from different disciplines around the globe can use to develop and test their own models.
Ideal for multimodal
research
CARS
POWERED TWO WHEELERS
TAXIS
BUSES

MEDIUM AND HEAVY VEHICLES
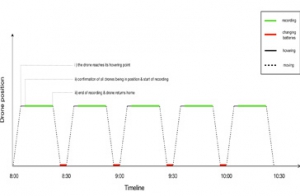
Illustration of the experiment
The swarm would take-off at the start of the experiment and each drone would go to its unique hovering point. Then, when all drones were at position, the recording of the traffic stream would start simultaneously and when the battery would run low, they would return to their landing point. Considering that drones could hover up to 25 minutes including take-off, routing and landing times, it was decided that each session would take place every 30 minutes for better coordination and standardization of the experiment.
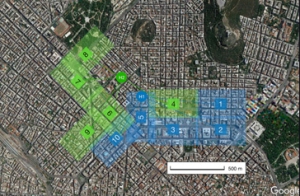
Set-up of the experiment
A swarm of 10 drones hovering over the central business district of Athens over five days to record traffic streams in a congested area of a 1.3km2 area with more than 100 km-lanes of road network, around 100 busy intersections (signalized or not), more than 50 bus stops and close to half a million trajectories.
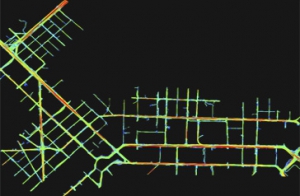
Extracted Trajectories from the whole Network
This is a speed heat map, produced from all the extracted vehicles from the first flight session (8:00-8:30) on Thursday, October 30. The trajectories are plotted on the map to visualize the road network that is covered during the pNEUMA experiment. It can be seen that all major arterials are monitored while there are some parts, mostly in minor roads, that are not fully covered due to visibility issues.
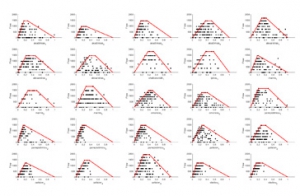
Fundamental Diagrams
High resolution flow density diagrams are plotted based on Eddie’s definitions for virtual loops. We see that the parameters of FDs vary across space and trapeziums with various parameters approximate the upper envelope of FDs.
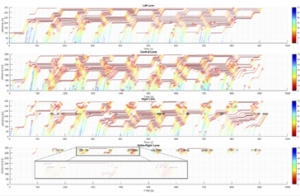
Multilane Time-Space Diagrams
The complete picture for a 3-lane road arterial (Alexandras Avenue) with a x-t diagram for each lane. The width of the road in the last 80 meters of the specific arterial includes an extra fourth lane and the x-t diagram of the extra lane can be seen in the bottom part of the figure. All red circles represent lane changes that remained in the study are while the black circles represent the vehicles that exited the study area from the right lane to adjacent roads of the network.
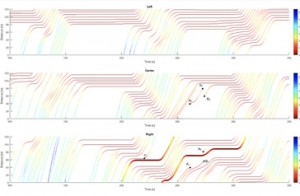
Multimodal Interactions
Local disturbances in a multimodal environment and how the way special vehicles (e.g. taxis, buses, delivery vehicles) affect the traffic flow characteristics. The service-related stops of all relevant modes create static and moving bottlenecks of different magnitude. The trajectories of two buses are shown with thicker lines in the right lane. The problem is quite complex because there is a traffic light at the downstream end that interacts with the bus stop.

Our vision
Recent Posts
TrajPT: A trajectory data-based pre-trained transformer model for learning multi-vehicle interactions
Eco-driving strategies using reinforcement learning for mixed traffic in the vicinity of signalized intersections